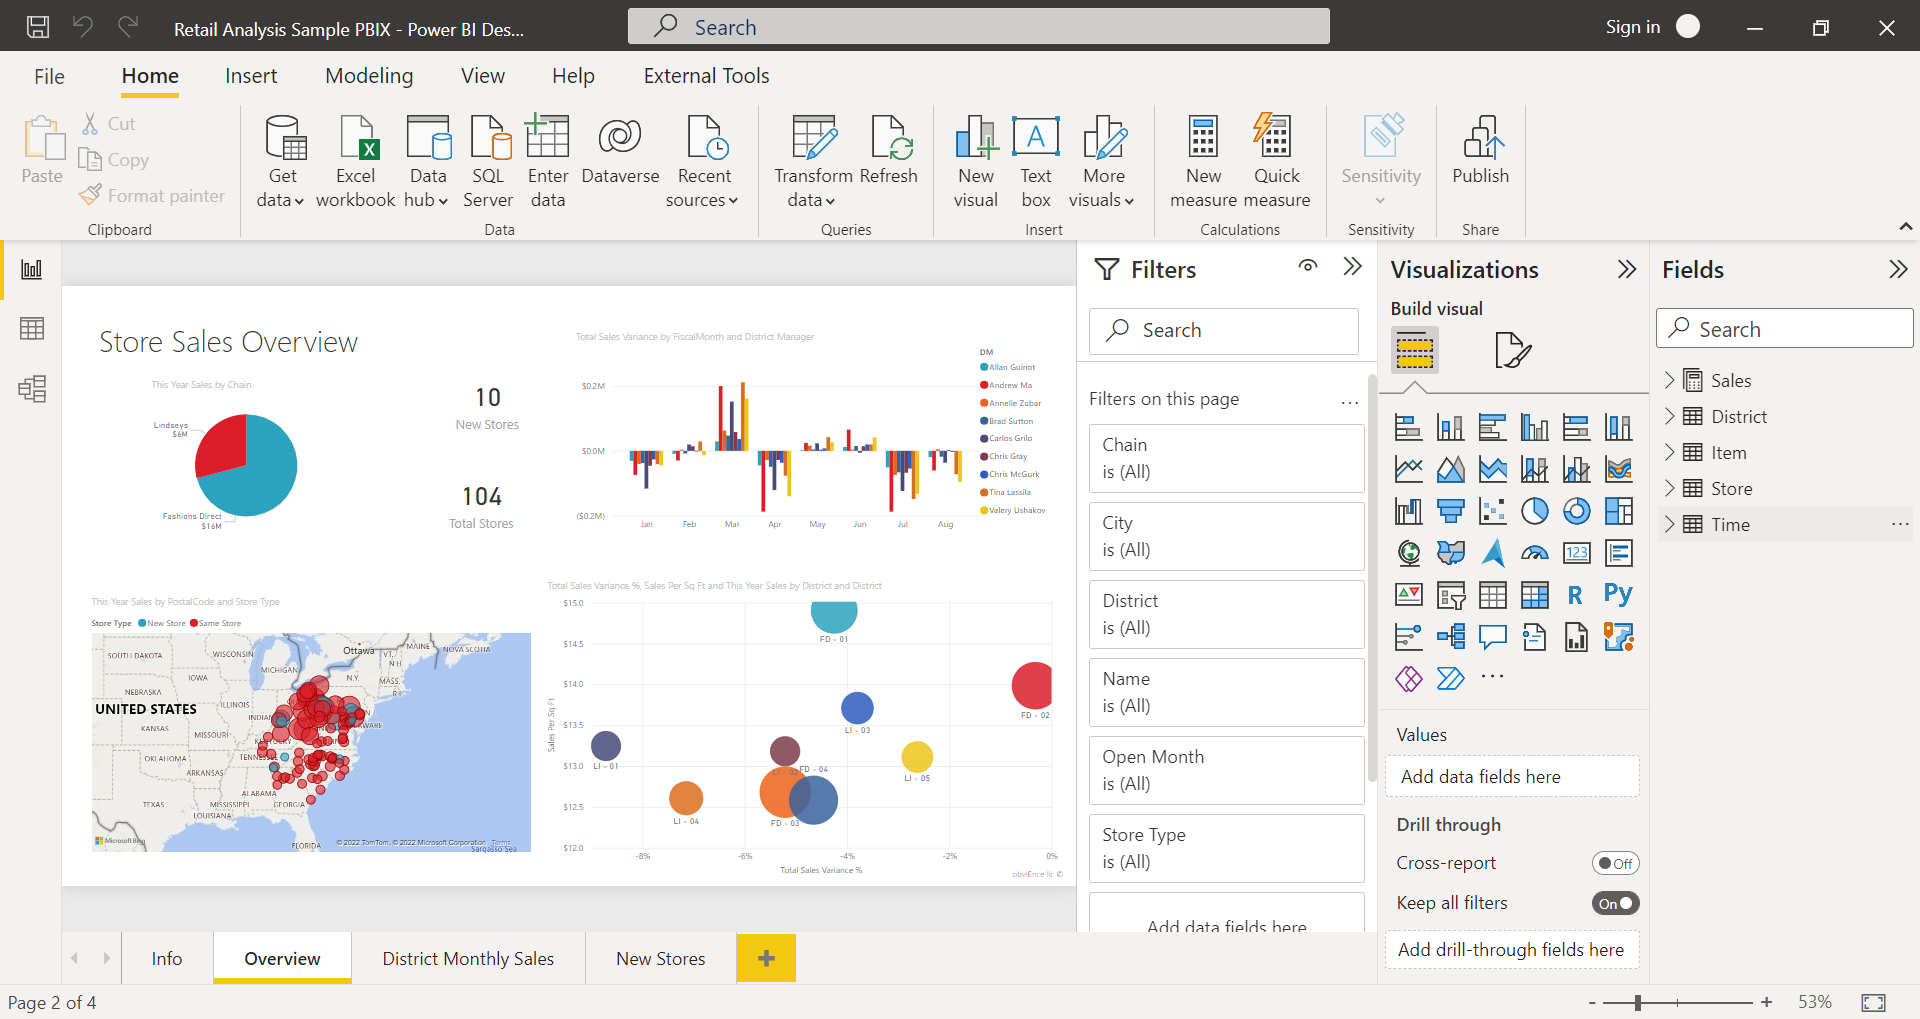
Microsoft Power BI: Complete Buyer's Guide
Transform ecommerce data chaos into actionable insights
Microsoft Power BI stands as the comprehensive business intelligence platform that transforms ecommerce data chaos into actionable insights through integrated AI capabilities and enterprise-grade analytics.
Market Position & Maturity
Market Standing
Microsoft Power BI maintains a dominant market position as a Leader in Gartner's 2024 Magic Quadrant for Analytics and BI Platforms [57].
Company Maturity
The platform demonstrates strong market maturity through Microsoft's established enterprise relationships and comprehensive support infrastructure.
Growth Trajectory
Growth trajectory indicators show Power BI's expanding market presence within the broader trend where 78% of organizations use AI in at least one business function [4][6].
Industry Recognition
Forrester's 2025 Wave recognized Power BI's generative AI functionality and semantic modeling capabilities specifically for retail data applications [56].
Strategic Partnerships
Strategic partnerships within Microsoft's ecosystem provide substantial competitive advantages, particularly for organizations utilizing Office 365, Azure infrastructure, or Dynamics 365 platforms.
Longevity Assessment
Power BI benefits from Microsoft's $60+ billion annual revenue and decades of enterprise software experience, providing buyers with confidence in long-term vendor stability and continued platform investment.
Proof of Capabilities
Customer Evidence
transcosmos Implementation Success: The global digital transformation company successfully deployed Power BI to bridge six ecommerce platforms, documenting measurable analyst hour savings through automated dashboard creation and RPA data collection [53].
Quantified Outcomes
Organizations report ROI within 3-6 months for implementations primarily focused on labor reduction through automated reporting [40][54].
Case Study Analysis
The transcosmos case study demonstrated that bridging six ecommerce platforms required 14 weeks for data mapping alone [53].
Market Validation
Market Validation shows Power BI's adoption among mid-market retailers utilizing 5-10 data sources while prioritizing Microsoft ecosystem integration [47][49].
Competitive Wins
Competitive Validation emerges through Power BI's Leader position in Gartner's 2024 Magic Quadrant [57].
Reference Customers
Enterprise Customer Evidence shows adoption patterns where organizations already invested in Microsoft ecosystems find Power BI delivers superior value through bundled licensing and infrastructure synergies [52][58].
AI Technology
Microsoft Power BI's technical foundation centers on Azure ecosystem integration that delivers enterprise-grade analytics through cloud-native architecture and AI-powered capabilities [39][41].
Architecture
The platform's architecture supports both cloud and on-premises deployment models, with hybrid connectivity through data gateways enabling legacy system integration [58].
Primary Competitors
Primary Competitive Landscape positions Power BI against Google Looker through superior Azure ecosystem integration and AI capabilities [56][58].
Competitive Advantages
Competitive Advantages center on Copilot integration that enables NLP-driven report generation without coding requirements [46][57].
Market Positioning
Market Positioning Strategy targets comprehensive analytics over point solutions, making Power BI ideal for organizations prioritizing unified data integration [52][58].
Win/Loss Scenarios
Win/Loss Scenarios show Power BI winning when organizations require comprehensive business intelligence within Microsoft's ecosystem [40][54][57].
Key Features

Pros & Cons
Use Cases
Integrations
Pricing
Featured In Articles
Comprehensive analysis of Business Intelligence for Ecommerce for Ecommerce businesses and online retailers. Expert evaluation of features, pricing, and implementation.
How We Researched This Guide
About This Guide: This comprehensive analysis is based on extensive competitive intelligence and real-world implementation data from leading AI vendors. StayModern updates this guide quarterly to reflect market developments and vendor performance changes.
58+ verified sources per analysis including official documentation, customer reviews, analyst reports, and industry publications.
- • Vendor documentation & whitepapers
- • Customer testimonials & case studies
- • Third-party analyst assessments
- • Industry benchmarking reports
Standardized assessment framework across 8 key dimensions for objective comparison.
- • Technology capabilities & architecture
- • Market position & customer evidence
- • Implementation experience & support
- • Pricing value & competitive position
Research is refreshed every 90 days to capture market changes and new vendor capabilities.
- • New product releases & features
- • Market positioning changes
- • Customer feedback integration
- • Competitive landscape shifts
Every claim is source-linked with direct citations to original materials for verification.
- • Clickable citation links
- • Original source attribution
- • Date stamps for currency
- • Quality score validation
Analysis follows systematic research protocols with consistent evaluation frameworks.
- • Standardized assessment criteria
- • Multi-source verification process
- • Consistent evaluation methodology
- • Quality assurance protocols
Buyer-focused analysis with transparent methodology and factual accuracy commitment.
- • Objective comparative analysis
- • Transparent research methodology
- • Factual accuracy commitment
- • Continuous quality improvement
Quality Commitment: If you find any inaccuracies in our analysis on this page, please contact us at research@staymodern.ai. We're committed to maintaining the highest standards of research integrity and will investigate and correct any issues promptly.