Dragonfly AI: Complete Buyer's Guide
Predictive attention analytics for packaging design optimization
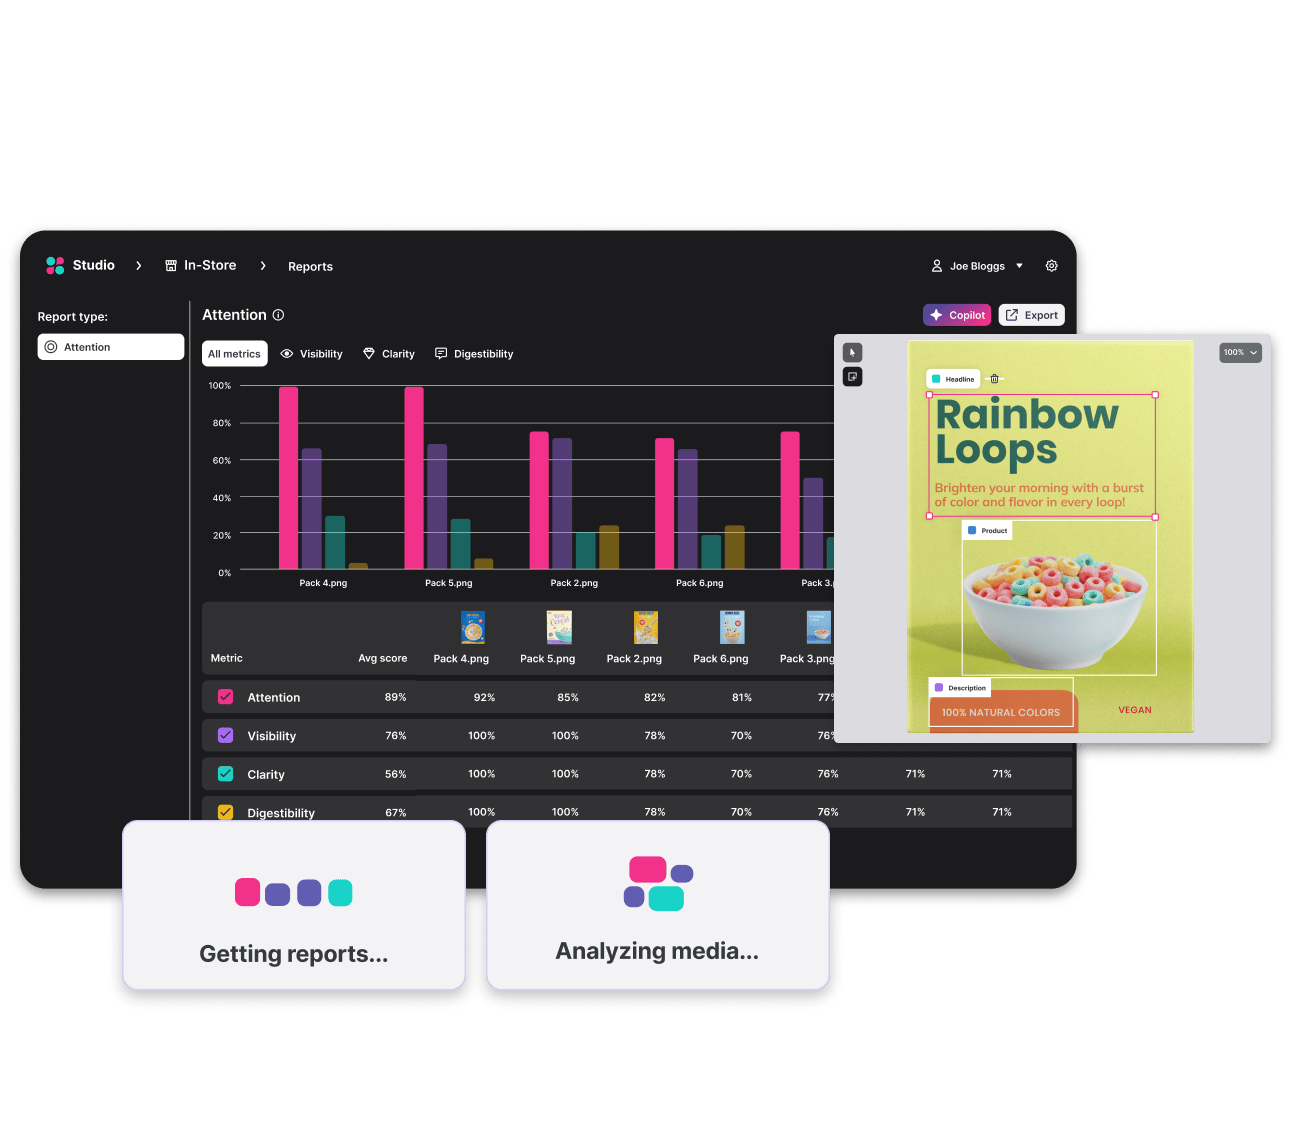
Dragonfly AI specializes in predictive attention analytics for packaging design optimization, offering a unique approach that transforms how brands validate visual impact before production. Unlike generative AI design tools, Dragonfly AI focuses exclusively on predicting consumer attention patterns through neuroscience-based algorithms trained on over 10 years of human visual data[53].
Market Position & Maturity
Market Standing
Dragonfly AI operates as a specialized attention analytics provider within the broader AI packaging design market, which reached $2.7 billion in 2024 and is projected to grow to $6.47 billion by 2034 at a 10.28% CAGR[2].
Company Maturity
Proven scalability across enterprise deployments and established integration partnerships with major creative platforms. The platform's API compatibility and Adobe Creative Cloud plugins demonstrate technical maturity and ecosystem positioning.
Growth Trajectory
Expanding customer implementations and documented business impact. Customer success stories showing 20-40% sales uplifts from optimized visuals[54][57].
Industry Recognition
Enterprise customer adoption and documented business outcomes rather than formal awards. The platform's 80% correlation between AI predictions and actual sales uplift[22] provides third-party validation.
Strategic Partnerships
Integration partnerships with major creative platforms.
Longevity Assessment
Evidence supporting long-term viability includes expanding customer implementations and documented business impact.
Proof of Capabilities
Customer Evidence
Birds Eye achieved 26% visibility boost over competitors and recorded 0.7% value growth with 1.9% volume growth year-over-year following redesigns validated by Dragonfly AI[52]. Beiersdorf reduced redesign cycles by 70%, optimizing global point-of-sale materials in 12 weeks versus the previous 6-month manual process[56].
Quantified Outcomes
89% accuracy against MIT saliency benchmarks[53] and 80% correlation between AI predictions and actual sales uplift[22].
Case Study Analysis
P&G's sensor network rollout exemplified successful enterprise deployment, starting with single production lines before scaling plant-wide after validating 15% energy savings[40].
Market Validation
Adoption across food & beverage (35% market share), healthcare/pharmaceuticals (28%), and consumer electronics (22%)[6].
Competitive Wins
Customer implementations show 45% higher attention capture than previous designs when combining AI predictions with limited consumer testing[52].
Reference Customers
Global CPG brands, pharmaceutical companies, and consumer electronics manufacturers.
AI Technology
Biological algorithm trained on over 10 years of human visual neuroscience data[53], enabling cross-market applicability independent of demographic data[45][53].
Architecture
Supports testing across digital and physical retail contexts through browser extensions and mobile applications[44][50].
Primary Competitors
Generative design tools like Packify.ai, enterprise creative suites like Adobe Express, and attention analytics competitors like Vizit[41][46][48].
Competitive Advantages
Biological algorithm approach trained on over 10 years of human visual neuroscience data[53], providing 89% accuracy against MIT saliency benchmarks and cross-market applicability independent of demographic data[45][53].
Market Positioning
Distinct competitive tier focused exclusively on predictive attention analytics rather than generative design capabilities.
Win/Loss Scenarios
Win when shelf standout is critical for business success, organizations possess resources for comprehensive integration, and sustainability compliance requires data-driven validation[51][52].
Key Features
Pros & Cons
Use Cases
Integrations
Pricing
Featured In Articles
Comprehensive analysis of AI Packaging Design Tools for AI Design for AI Design professionals. Expert evaluation of features, pricing, and implementation.
How We Researched This Guide
About This Guide: This comprehensive analysis is based on extensive competitive intelligence and real-world implementation data from leading AI vendors. StayModern updates this guide quarterly to reflect market developments and vendor performance changes.
57+ verified sources per analysis including official documentation, customer reviews, analyst reports, and industry publications.
- • Vendor documentation & whitepapers
- • Customer testimonials & case studies
- • Third-party analyst assessments
- • Industry benchmarking reports
Standardized assessment framework across 8 key dimensions for objective comparison.
- • Technology capabilities & architecture
- • Market position & customer evidence
- • Implementation experience & support
- • Pricing value & competitive position
Research is refreshed every 90 days to capture market changes and new vendor capabilities.
- • New product releases & features
- • Market positioning changes
- • Customer feedback integration
- • Competitive landscape shifts
Every claim is source-linked with direct citations to original materials for verification.
- • Clickable citation links
- • Original source attribution
- • Date stamps for currency
- • Quality score validation
Analysis follows systematic research protocols with consistent evaluation frameworks.
- • Standardized assessment criteria
- • Multi-source verification process
- • Consistent evaluation methodology
- • Quality assurance protocols
Buyer-focused analysis with transparent methodology and factual accuracy commitment.
- • Objective comparative analysis
- • Transparent research methodology
- • Factual accuracy commitment
- • Continuous quality improvement
Quality Commitment: If you find any inaccuracies in our analysis on this page, please contact us at research@staymodern.ai. We're committed to maintaining the highest standards of research integrity and will investigate and correct any issues promptly.